The Gantt chart is a tool allowing users to visualize all the tasks of a project over time. Essential for managers, it is now part of the features offered by our Nutcache online solution!
Do you have your own account on Nutcache? In this article, we will guide you step by step in creating your own Gantt chart. To access this feature, you need to go to your project’s home page, and then click on the “GANTT” tab. If you have not added any tasks to your project, the diagram is empty. However, rest assured: after creating your chart, no task will escape your gaze!
Divide the project into tasks
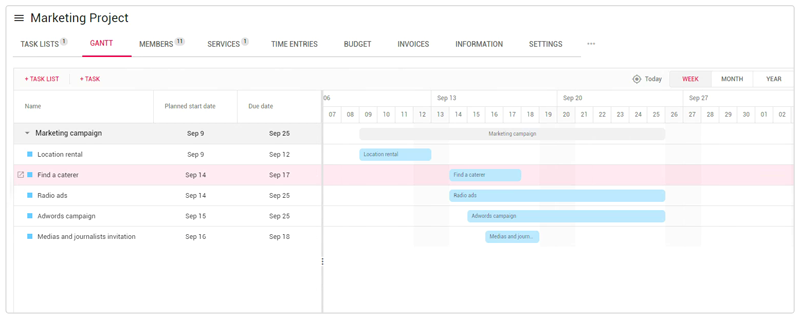
The first step in project planning, not the least, is to divide your project into chronological phases. Then, from these phases, list the tasks to be performed in your Gantt chart by clicking “+TASK” and then completing the requested information.
Let’s take the example of a marketing project. Your client, a publishing house, calls on your team to promote the release of a book. What are the actions to be taken to promote this product? Depending on your client’s needs and budget, there are many possibilities: social networks, influencers, public launch, etc.
Once you have agreed with your client on an action plan, you can then divide the plan into tasks. For example, if you are going ahead with a launch, there are several tasks to consider: renting the room, writing an invitation to journalists, calling a caterer, and much more! The important thing is that your plan is as detailed as possible.
Establish the start and end dates for each task
Now that you have listed all the tasks on your Gantt chart, you need to determine when you are going to handle each of these tasks. If you start too early, your actions may not have the desired effect you want. However, if you start too late, it will have repercussions on other tasks.
You also need to set a deadline for each task, which is an end date that determines the moment when the project starts to fall behind. To use the previous example, if your book launch takes place on September 25 and you want to invite journalists, it is suggested you contact them about 7 to 10 days before the event. Your task, consisting of sending out invitations, will be September 15 and 18 for the start and end dates.
Assign your team members to tasks
Also, from your Gantt chart, you can designate the members of your team responsible for each task. For example, for the book launch, you entrust Jonathan with the task of contacting journalists. To do this, you need to go to your list of tasks and select the task to be performed. Note that this action can also be done directly from your Gantt chart, by clicking on the open file icon. Then click on the icon representing a person. In the new window, enter Jonathan’s full name, then click “ASSIGN.” The icon representing him will then appear to the right of the task. On a Gantt chart, this feature makes it easier for teammates to communicate.
Define the dependencies between the tasks
It is well known that for a project to work, all team members must participate in the performance of tasks. In such a situation, some tasks will depend on others. In the example of the book launch, in order for Jonathan to contact journalists, he must receive the invitation written by Josiane.
When creating your Gantt chart, it is possible to create dependencies between tasks. To start, go to your chart. Starting with the first task (e.g., writing the invitation), click on the small circle to the right of the task, then slide to the left circle of the second task (e.g., contact with journalists). When you release the click, a gray arrow will appear between tasks, indicating a dependency.

Keep track of the project (and adjust as needed)
In order to ensure that there is no delay in your project, it is important to follow up regularly with your team. Check with each member of your team to see if everything is going well in carrying out their tasks. And if there is any problem, it is possible to adjust your Gantt chart as needed.
Be prepared to adapt to any unforeseen events. Going back to our promotional example, if the book’s printing is postponed, it could affect its launch. In your diagram, it is possible to adjust the start and end dates of your tasks. To adjust the start date, click on the three small dots to the left of the task to be modified and drag the cursor to the new date. The same process applies to the end date, but by clicking on the three small dots on the right. If you prefer to keep the same interval of days devoted to the task, click on the task and drag it from right to left or left to right.
There you go! Now you know how to plan a project with a Gantt chart! Thanks to our Nutcache online solution!
Don’t have a Nutcache account? Do you know that it is not just used to create Gantt charts? It is a comprehensive management tool with which it is possible to track all aspects of a project, from the creation of tasks to billing to the control of expenses. Explore Nutcache’s many possibilities by signing up for a free 14-day trial!


